Minecraft Server Audit
Analysis of Minecraft KPIs

< b/w >
Analysis of Minecraft KPIs

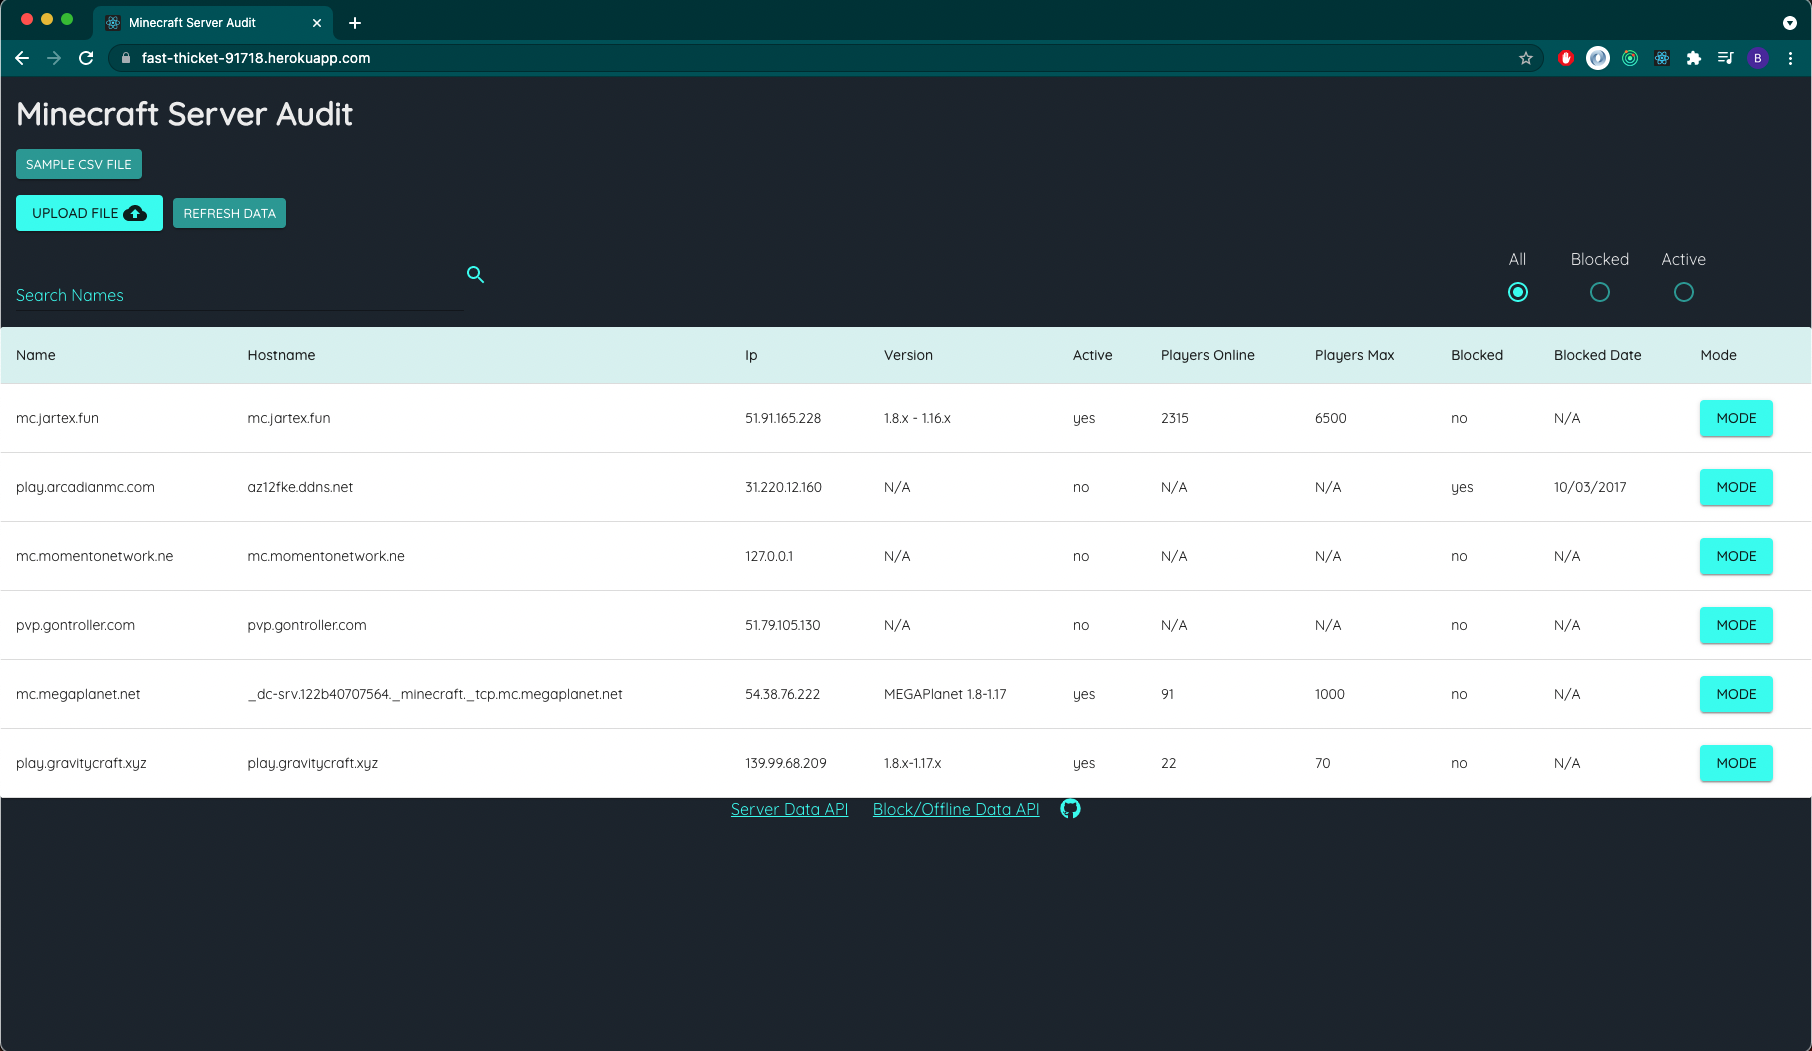
This is a tool I built for a client who monitors Minecraft Servers. In order to organize the data in an effective manner, I decided to use the React library to build reusable components for the data rows, and used the Material UI TableComponent for a smooth interface.

A .CSV file with a single column listing individual Minecraft Server urls is uploaded to the application, and an assortment of data is returned.
This allows for users to pick and choose what servers they want to investigate without any hard coded data they would need to work around.
All of the data is fetched from external APIs - links are at the bottom of the webpage if users want to know where the information originates.
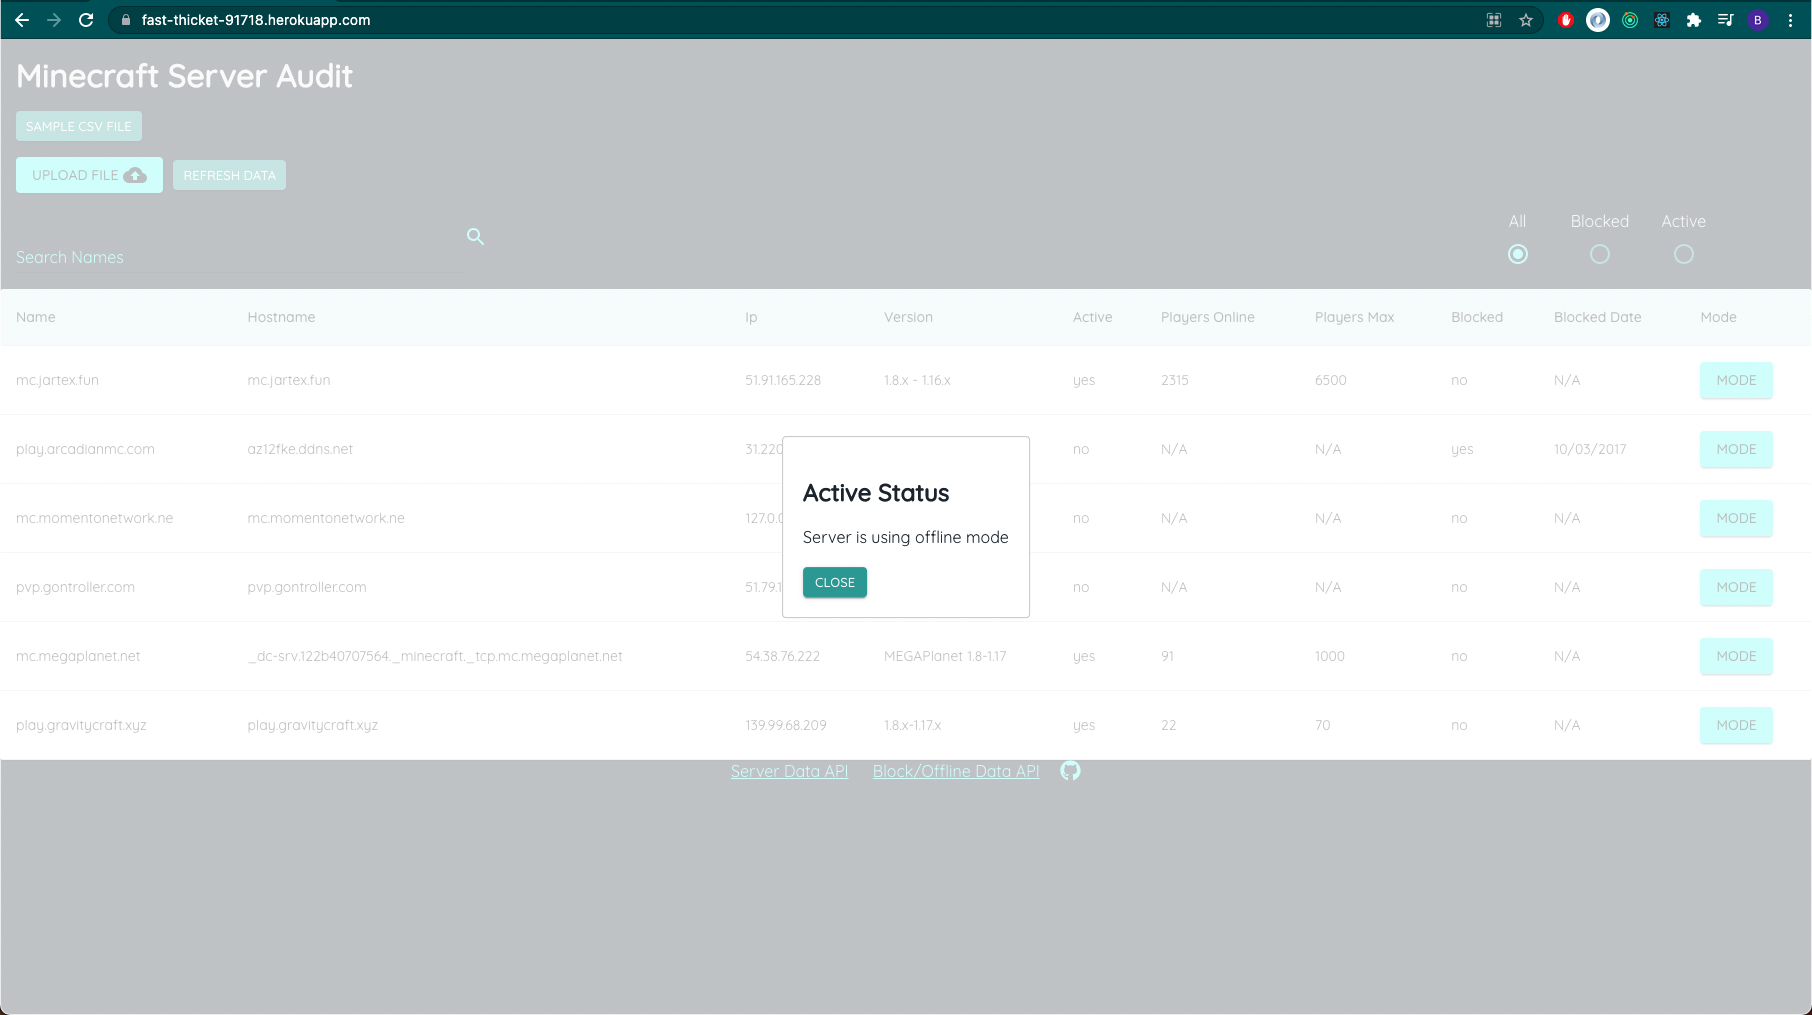
Clicking the 'MODE' button informs the user of the server mode - it may be ACTIVE, but not online.
This is another data fetch, but it needed to happen separately from the initial data fetch to increase responsiveness. The fetch can take sometime to return data as the API host tends to crash if overloaded.

Current displays can be refreshed by clicking 'REFRESH' - it was important for this to happen without a complete reload of the webpage to save users the hassle of uploading the same file twice.
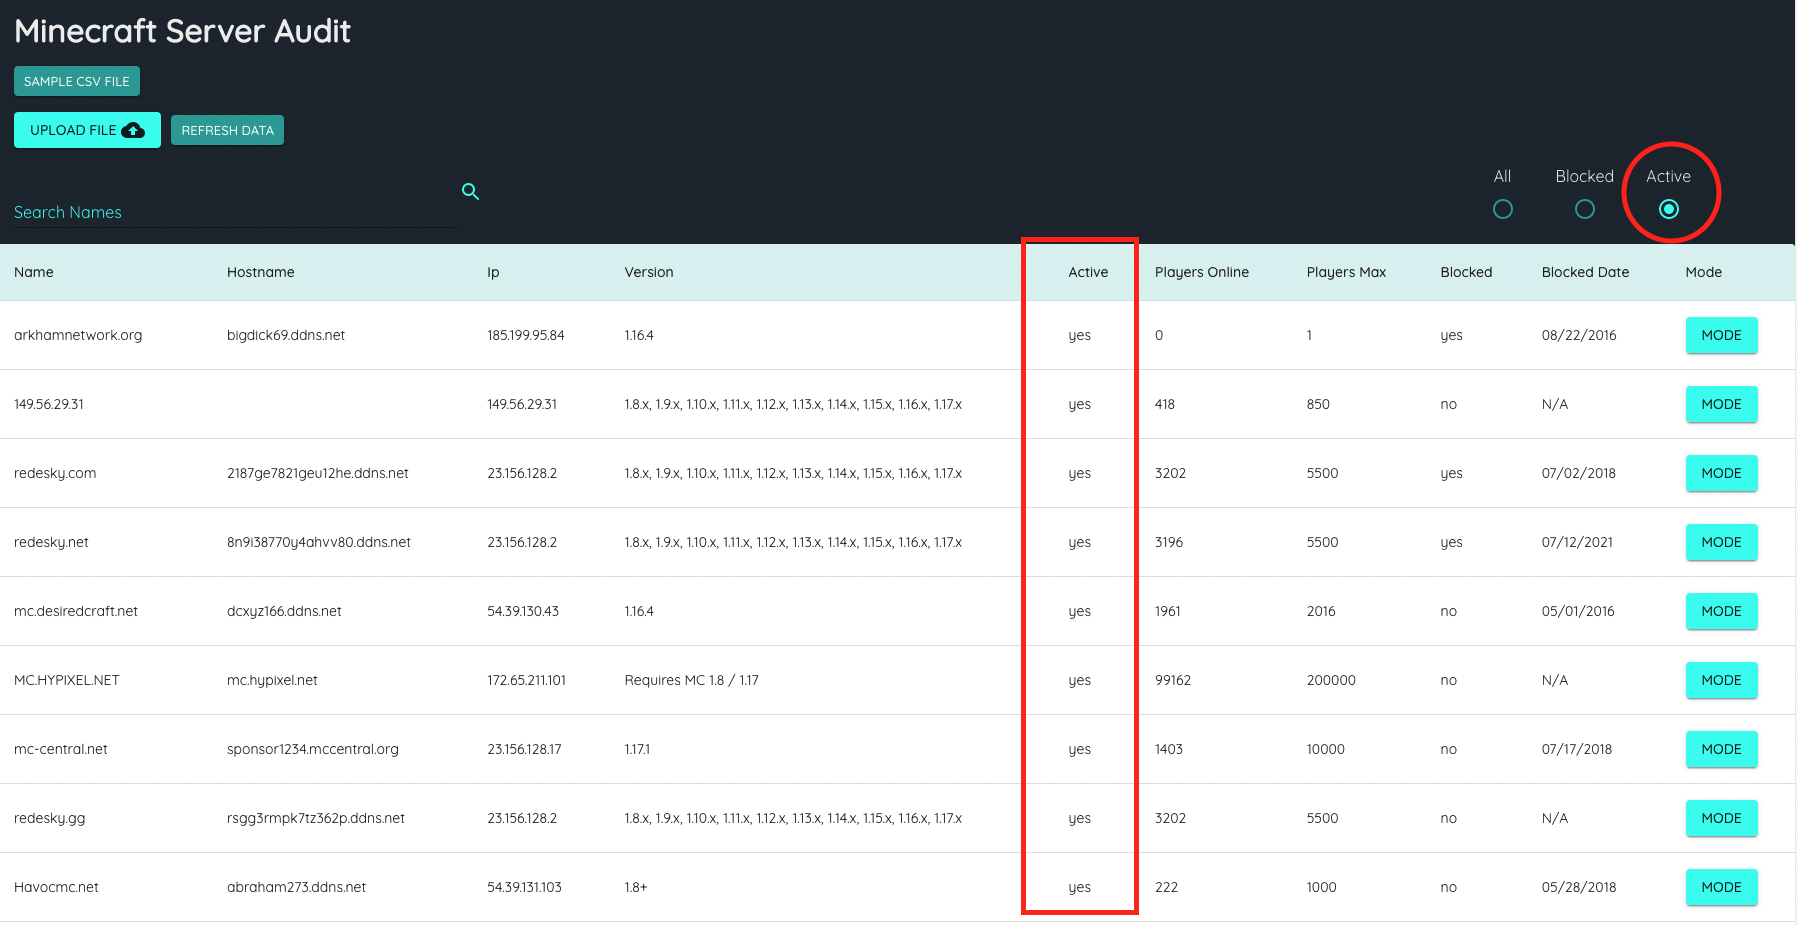
The data can be filtered by 'BLOCKED' or 'ACTIVE', and users can look up servers by name. I used Redux to easily manipulate the view based off of the selected radio button.


At the request of the client, I've built a second page and navbar to switch between the two pages.
The new feature allows for single server searches into a text input. On 'SEARCH', page retrieves all data including the 'MODE' information without the need of clicking a button to see the results.
Data from the single search will stay in the results table until cleared so users can quicksearch many individual servers and see the data.
Check out the live site for yourself!